VWAP for Day Trading: Settings, Anchored VWAP & TradingView Setup
-
 Posted by
 - Date October 2, 2025
- Comments 0 comment
Imagine walking into a busy market. Some traders are shouting prices, others quietly striking deals. By the end of the day, there’s a kind of “average check” – a number that shows where most of the money really changed hands. That, in a nutshell, is VWAP, the Volume Weighted Average Price.
VWAP isn’t just another indicator on your chart. It’s a dynamic benchmark that blends price and volume, showing where the bulk of trading activity happened during the session. For intraday traders, that’s gold: it reveals whether the “smart money” – big funds, institutions, algorithms – are buying above or below that average.
Think of it this way: if price stays above VWAP, the crowd is willing to pay a premium – sentiment is bullish. If it slips below, something’s off, and sellers are taking over. VWAP helps you see this flow in real time, without guesswork.
What makes it evergreen is its adaptability. You can use VWAP on Nasdaq, NYSE, Forex, futures, even crypto – any market with volume data. It’s not tied to a single asset or timeframe; it’s tied to behavior.
In this guide, we’ll break down how to use VWAP for day trading, explore VWAP vs Anchored VWAP, go through the best VWAP settings for day trading TradingView, and show how traders build a VWAP day trading strategy step by step. Whether you’re scalping a Nasdaq breakout or backtesting your setup on a Forex session, this tool can become the heartbeat of your execution plan.
What is VWAP and How It Works in Day Trading
VWAP stands for Volume Weighted Average Price. It’s the running “average check” of a market, but weighted by how many shares/contracts actually traded at each price. In intraday terms, it answers a simple question: where did most of today’s money change hands?
The formula is straightforward:
VWAP = (sum of price × volume) ÷ (sum of volume)
Both sums are cumulative from the start of the trading session. Each new trade or candle updates those totals, so the line you see on your charts is a live, session-based average that reflects real participation, not just price swings.
How the calculation unfolds during a session
At the opening print, Volume Weighted Average Price starts at the first traded price. As more trades tick in, you add up (price × volume) and divide by total volume so far. Heavy prints matter more. A single large block at a new price can pull VWAP toward it; a light flurry of small lots barely nudges it. That’s why day traders like the volume-weighted average: it moves only when meaningful volume says so.
A quick toy example using 1-minute candles:
- Minute 1: price 100, volume 1,000 → cumulative (100×1,000)=100,000; VWAP = 100,000 / 1,000 = 100;
- Minute 2: price 102, volume 1,000 → cumulative (100,000 + 102,000)=202,000; VWAP = 202,000 / 2,000 = 101;
- Minute 3: price 101, volume 500 → cumulative (202,000 + 50,500) = 252,500; VWAP = 252,500 / 2,500 = 101.
You can see how a high-volume move at 102 lifted the volume-weighted average from 100 to 101, and then a lighter candle barely changed it. In practice, that stickiness filters noise and emphasizes where real activity is concentrated.
VWAP vs Moving Average
A simple or exponential moving average looks only at price. It treats a thin uptick at noon the same as a massive opening auction print. VWAP doesn’t. By weighting by volume, VWAP tilts toward the prices where the crowd actually executed.
Before the list, one more nuance: a moving average can be computed over any rolling window (say, the last 20 candles), while classic Volume Weighted Average Price always accumulates from the day’s open until the session ends.
Now the key contrasts:
- Moving Average: price-only indicator, each candle counts the same (SMA) or decays by time (EMA), regardless of volume;
- VWAP: price х volume, high-volume candles dominate, low-volume wiggles don’t;
- Window: MA uses a rolling lookback, the volume-weighted average is session-anchored and resets at the next open;
- Use case: MA for smoothing trend, Volume Weighted Average Price for intraday execution context and quality.
After this comparison, the takeaway is simple: MA shows where price drifted, the volume-weighted average shows where traders actually met and traded size.
On charts: when price and VWAP overlap vs diverge
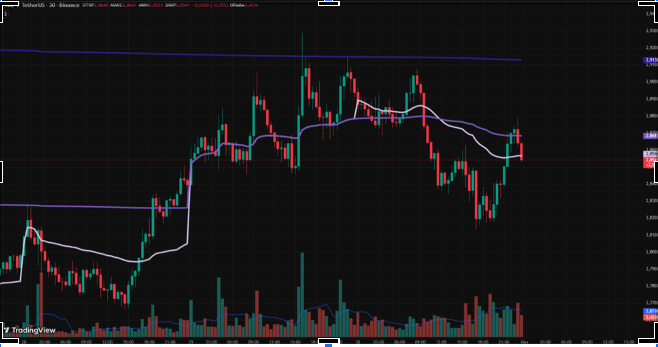
In quiet, balanced tape (think midday chop on Nasdaq/NYSE), price and VWAP often hug each other. Candles cross the line repeatedly, and the market behaves like it’s orbiting a fair value. That overlap tells you participation is evenly split above and below the line – no strong momentum edge.
During momentum bursts, they diverge. Example: strong open where buyers lift offers, volume is heavy, and price drives away from VWAP. The line lags (by design), leaving visible air between current price and Volume Weighted Average Price. On trend days, that gap can persist for hours; on range days, price tends to mean-revert and “test” VWAP like a magnet.
A practical read:
- Price riding above VWAP with higher highs and higher lows → bullish trend context; VWAP can act as dynamic support;
- Price grinding below the volume-weighted average with failed pops → bearish context; VWAP can act as dynamic resistance.
You don’t need a fancy platform to see this; any standard indicator pack will plot VWAP cleanly on 1-, 5-, or 15-minute charts.
Why institutions care
For funds and execution desks, Volume Weighted Average Price is a benchmark. A buy program that averages fills below VWAP is considered “good” because it paid less than the day’s volume-weighted average, a sell program that gets fills above VWAP is good for the same reason. That’s why many execution algorithms (including classic “VWAP algos”) aim to track the intraday volume curve and stay close to the line.
This institutional focus gives retail traders a useful anchor. When you ask yourself how to use VWAP for day trading, remember the core idea: align with where size is printing. If the tape is trending and price holds one side of VWAP, you have context for momentum or breakout entries.
If the tape is balanced and price keeps snapping back to the line, you have context for reversion or scalping around that fair-value level. And once you understand how to set up VWAP for day trading – choosing the right reset, session, and visibility on your platform – the indicator becomes not just a line, but a framework for consistent execution.
VWAP vs Anchored VWAP – Key Differences
If you’ve used the regular Volume Weighted Average Price for day trading, you already know it “resets” each morning – clean slate, fresh session, new calculation. The logic is simple: the volume-weighted average is designed to represent today’s fair value, from the opening bell to the closing print. Once the market closes, all that cumulative math gets cleared out. Tomorrow’s VWAP starts from zero and builds again from the first trade.
That daily reset makes perfect sense for intraday execution. It keeps VWAP tied to one trading session, so you can see whether the market’s leaning bullish or bearish today, without any baggage from previous days. It’s the tool for short-term traders who live and breathe the current session’s rhythm – especially scalpers on Nasdaq or NYSE, where each session has a distinct structure and volume curve.
But what if you want to study a bigger move – something that began days or even weeks ago? That’s where Anchored Volume Weighted Average Price comes in.
Anchored VWAP: the “pinpoint” version
Anchored VWAP was popularized by Brian Shannon from Alphatrends, and it changed the game completely. Instead of always starting at the open, you choose where to begin the VWAP calculation. You can “anchor” it to a specific event on the chart – for example:
- the candle of a major earnings gap;
- a breakout from consolidation;
- a trend reversal bar;
- or a clear support/resistance pivot.
Once you place that anchor, the indicator recalculates the volume-weighted average price starting from that point forward. This lets you see how price has behaved since that critical event – whether buyers have been paying above or below that key average.
In TradingView, setting it up is straightforward: open the indicator list, search “Anchored VWAP,” and click on the exact candle you want to anchor to. The platform instantly draws a separate Volume Weighted Average Price line starting from that bar. You can even run multiple anchors at once to visualize how different market phases interact.
Imagine a TradingView chart with two VWAPs plotted together:
- one standard the volume-weighted average, starting from today’s open, hugging the current intraday swings;
- another Anchored VWAP, starting from a major breakout two weeks ago, stretching across the chart and showing how the long-term crowd is positioned.
In that visual, the anchored line often acts like a deep current beneath the day’s surface waves. While the daily Volume Weighted Average Price tells you where traders are focused today, the anchored one shows where they’ve been positioning since a meaningful turning point.
Practical use: when each version shines
It helps to think of them as serving different trading tempos.
- Standard VWAP: best for intraday scalping and momentum tracking. It’s reactive, session-based, and updates with each new candle’s volume. When you’re focused on quick execution or timing a breakout, that’s your reference line;
- Anchored VWAP: best for swing trades, multi-day analysis, or institutional-style entries. It captures how price behaves relative to a chosen event, making it a compass for bigger trends and sustained momentum plays.
For instance, after a stock gaps up on strong earnings, a trader might anchor VWAP at the first candle of that gap day. If price keeps finding support near that anchored line in later sessions, it signals that large buyers have been defending that level – and the trend likely remains intact. This type of setup is a classic example of anchored VWAP day trading, where traders use event-based anchors to track institutional positioning across sessions.
Anchored Volume Weighted Average Price effectively merges price, volume, and time into one adaptive layer of context. Instead of viewing all trading activity as one block, it lets you isolate specific phases of behavior – what happened after a breakout, how volume behaved after a reversal, where real buyers stepped in after a flush.
Best VWAP Settings for Day Trading (TradingView & Platforms)
Most modern trading platforms – TradingView, Thinkorswim, MetaTrader 4/5, and even NinjaTrader – already include the volume-weighted average price indicator by default. You don’t need to install custom scripts or complex algorithms: just search for “VWAP” in your platform’s indicator library and it’s ready to use.
What matters isn’t the installation, but the settings – how you configure the reset period, timeframes, and visual layout for your particular market. Each instrument behaves differently through the trading day, so the way you anchor or refresh the average line determines how useful it will be in your execution decisions.
Common setups and reset options
The simplest setup is to let the tool reset daily. This is the default on most platforms and works perfectly for markets with a fixed open and close, like Nasdaq or NYSE. When the new session begins, the average price starts counting from the first candle. For scalping and high-frequency intraday trading, this is the cleanest approach – you always compare today’s action to today’s average.
But not all markets have a clean daily rhythm. In Forex, for example, trading runs 24 hours a day, split into sessions – London, New York, Tokyo. Here, a “reset per session” setup is far more logical. It lets you track how the price behaves relative to its own regional volume wave instead of the entire 24-hour cycle. Traders often anchor the line to the start of the London or New York session to catch breakouts when liquidity surges.
For futures or continuous instruments traded on Globex, a different approach can help. Many professionals use weekly resets or even anchored averages tied to Monday’s open. This broader scope smooths out noise and acts as a trend confirmation layer, giving a sense of where institutional flow has been accumulating over multiple days.
Before the table, one more note: some traders plot multiple averages on intraday charts – for example, one calculated from the 1-minute feed, another from 5-minute, and a slower 15-minute line. This creates a stacked structure of levels that shows how price interacts with volume across several granularities. When all three align, it’s often a strong signal for momentum continuation or mean-reversion setups.
| Market | Session | Reset Type | Notes |
| Nasdaq | US (9:30–16:00) | Daily reset | Great for scalping and short momentum trades |
| Forex | London | Anchored to session start | Best for breakouts and intraday swings |
| Futures | Globex | Weekly average | Helps confirm overall trend direction |
Each of these reset modes gives a different lens on price-volume dynamics. The shorter the reset, the more responsive the line – perfect for quick execution decisions. The longer or anchored types give smoother context and help avoid false signals in choppy periods.
When fine-tuning your Volume Weighted Average Price settings for day trading in TradingView, consider your time horizon first:
- if you’re reacting to every tick, keep the reset tight – one session, one day;
- if you’re trading structured setups, like post-earnings consolidations or multi-day trends, extend or anchor the calculation to that specific event.
In short, there’s no “universal” configuration. The best setup is the one that reflects the session behavior of your market and supports your trading tempo – whether that’s lightning-fast scalping on Nasdaq or patient breakout hunting across global sessions.
VWAP Day Trading Strategies Explained
The volume-weighted average price can act both as a dynamic level and as a trade filter. It’s flexible: sometimes you treat it as a line of defense or magnet for price, and other times as a confirmation tool for trend continuation. In day trading, this dual nature makes it valuable for almost any execution style – from fast scalping to structured momentum setups. Let’s unpack three of the most practical ways to use it.
VWAP as Dynamic Support/Resistance
When price trades above the session’s average line, the crowd is paying a premium – the market is in a bullish trend. When it spends most of its time below, the sentiment flips bearish. In that sense, Volume Weighted Average Price acts like a live equilibrium: bulls defend it from above, bears from below.
At the Nasdaq open, you can often watch the tug-of-war play out. After the first 5–10 minutes of heavy volume, the market typically tests the average level. If buyers reclaim it and candles close above with expanding volume, the session often evolves into a long-side move. If price rejects it and falls back under, that test turns into confirmation of intraday resistance.
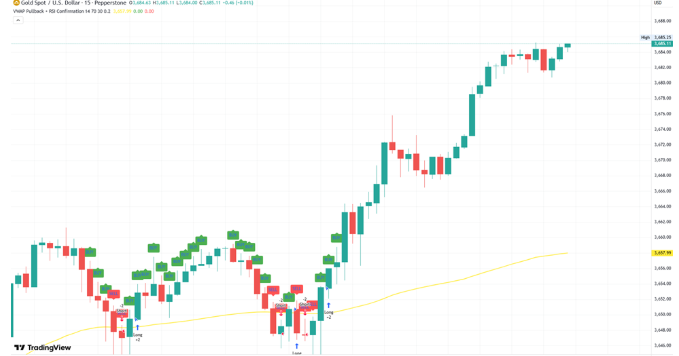
You’ll see this clearly on charts – price waves oscillating around a smooth central curve. The first touch after a strong push can behave like a classic support or resistance retest. Short-term traders use these bounces for quick entries with tight stops, while larger players watch for trend validation.
VWAP + Breakout Confirmation
Breakout traders often combine the average-price indicator with momentum filters. The logic is simple: if the market breaks a key horizontal level and stays above its weighted average, the move is likely backed by real participation – not just a thin spike.
A practical rule-of-thumb:
- go long only on breakouts above the average line, ideally after a clean consolidation just under it;
- avoid longs when breakouts occur below it – they often fade fast;
- for shorts, flip the logic: breakouts under the average line confirm downside momentum.
Here’s how that looks in practice:
- Identify a tight base on your 5-minute candles – maybe a premarket consolidation.
- Wait for the volume surge that pushes price through resistance.
- Check the indicator line – if the price is now above it and holding, that’s your entry trigger.
- Place a stop just below the breakout candle or the average itself.
- Target 1:2 or better risk/reward as momentum continues.
This setup helps filter noise. Many fake outs happen when breakouts occur below the volume-weighted average – those are typically low-quality executions without institutional backing. When price clears both resistance and the weighted average, it shows that buyers are in control of the current session.
VWAP Reversion Trades
Not every trading day trends. In range-bound markets, price tends to stretch away from its mean and then drift back – like an elastic band snapping to equilibrium. The average price line becomes the gravity center. When price gets overextended from it, a reversion setup appears.
The concept: when price pushes far above the average on low momentum, you look for short entries expecting a fade back toward fair value. When it drops sharply below thin volume, you look for a long reversion. This strategy relies more on context – sideways volatility, overlapping sessions, reduced directional conviction.
Here’s a quick reference guide:
| Time Window | Market Type | Volatility | When to Consider a Reversion Trade |
| 10:30–12:00 (US) | Nasdaq / NYSE | Low | Price extended >1% from VWAP, candles losing range |
| London afternoon | Forex | Moderate | Session overlap, mean reversion toward anchored level |
| Late US session | Futures | Mixed | Trend exhaustion, fading volume, flat slope of VWAP |
Reversion setups require patience. You’re waiting for the market to show exhaustion – small-bodied candles, fading volume, and a flattening of the average’s slope. The ideal trade happens when traders on both sides start closing positions, pulling price back toward equilibrium.
Keep stops wide enough to handle noise, and always confirm that the day lacks strong directional momentum. If the market’s trending hard, the “rubber band” can stay stretched longer than expected – fading it too early is one of the classic mistakes.
Risk Management and Backtesting VWAP Strategies
Even the best setup around the volume-weighted average price can turn into a disaster if you trade it without a plan. The line may look reliable, but it’s not a safety net. Without a stop-loss, Volume Weighted Average Price won’t save you – it can only guide, not protect. Real control comes from proper risk management and disciplined testing of your rules before risking live capital.
VWAP-based trading systems are often simple in logic but dangerous in execution. Because the line tracks real volume, traders start to believe it’s always “right.” It isn’t. Price can and will overshoot, fake out, and trap entries, especially during volatile sessions like the Nasdaq open or macro news on Forex. That’s why every trade plan needs structure.
A basic VWAP trade structure
Let’s break down a minimal framework for a VWAP day trading strategy – one that defines entries, stops, and targets clearly before execution.
- Entry Point – This is your signal from the indicator. Maybe price reclaims the weighted average after a morning sell-off, or a breakout candle closes above it on strong momentum. The goal is not to predict but to react – the signal tells you where volume confirms direction.
- Stop-Loss – Always set it beyond the local extreme. For a long entry, place the stop just below the recent swing low or one full candle body under the line. For shorts, put it above the nearest high. This keeps the stop logical – tied to real support/resistance rather than arbitrary ticks.
- Target – Plan for at least a 1:2 risk/reward ratio. If your stop is 10 points, your first profit target should be 20. It ensures that even with 50% accuracy, your account still grows. For trending conditions, trail your stop along the indicator slope; for range setups, exit fully at the first touch of VWAP or opposing band.
In short: signal, protection, and goal – no exceptions. That structure turns an idea into a repeatable algorithm.
Testing and performance tracking
Before trusting any setup live, backtesting is crucial. Modern platforms make it easy:
- In TradingView, you can use the built-in strategy tester to simulate entries whenever price crosses, touches, or rejects the Volume Weighted Average Price line. Adjust for sessions, filters, or anchored periods;
- Outside the platform, many traders maintain a manual Excel journal. It takes time but builds intuition – you log the ticker, session, entry, stop, target, and outcome. Over a few dozen trades, you’ll see clear statistics: win rate, average reward, and risk exposure.
A hybrid approach works best: start automated to spot patterns, then refine manually to understand context.
Here’s a simple example of what a 5-trade record might look like during testing:
| Trade # | Market | Session | Direction | Entry Type | Stop (pts) | Target (pts) | Result (P/L) |
| 1 | Nasdaq | US Open | Long | VWAP reclaim | 8 | 16 | +16 |
| 2 | Forex | London | Short | Break below VWAP | 12 | 24 | +24 |
| 3 | Futures | Globex | Long | Mean reversion | 10 | 20 | -10 |
| 4 | Nasdaq | Midday | Long | VWAP bounce | 7 | 14 | -7 |
| 5 | NYSE | US Close | Short | Momentum fade | 6 | 12 | +12 |
After five trades, your cumulative P/L = +35 points, even with two losses. That’s the power of a defined risk/reward ratio.
Key takeaway
The goal isn’t to make every trade profitable – it’s to survive the bad ones. Volume Weighted Average Price can tell you where the crowd is trading, but it can’t stop a flash drop or news-driven reversal. Only structure can.
So, when thinking about how to use the volume-weighted average for day trading, start with the boring parts: your stop rules, your targets, your testing log. Once those are consistent, the indicator becomes a weapon instead of a toy. Backtesting turns intuition into data, and data keeps emotions out of the trade – which is, in the end, what separates surviving traders from those who just follow lines on a chart.
FAQs about VWAP Day Trading
Is VWAP good for day trading?
Yes, it’s a solid intraday reference that shows whether price trades above or below the average volume level. Just remember – it’s a guide, not protection, so risk management is still essential.
VWAP vs Anchored VWAP – what’s the difference?
The classic version resets daily and tracks each trading session from the open. Anchored VWAP starts from any chosen candle or event, making it better for multi-day or swing analysis.
How do I set up VWAP on TradingView?
Open Indicators → search “VWAP” → set reset to “daily” for stocks like Nasdaq or NYSE. For Anchored VWAP, pick the candle where you want the calculation to begin.
Can VWAP be used for scalping?
Yes, especially on Nasdaq, where it helps confirm short-term momentum and breakouts. Many scalpers trade only in the direction of price relative to the average line.
Does VWAP work on Forex?
It does, but since Forex has no fixed open or close, use session-based or anchored setups. Most traders start the line from the London or New York session for clearer context.
Conclusion
At its core, the volume-weighted average price is a map of where real money trades – the silent footprint of institutions inside every intraday move. It doesn’t predict direction; it reveals balance.
When you understand how to use VWAP for day trading, it stops being just a line on your chart and becomes a context filter – telling you when momentum is genuine and when it’s noise. Use it to align with liquidity, not to chase it, and every trade starts to make more structural sense.