Liquidity Grabs & Stop Hunts in Forex/Gold: A Price-Action Guide
-
 Posted by
 - Date October 4, 2025
- Comments 0 comment
If you’ve ever been stopped out of a trade right before price reverses in your original direction – congratulations, you’ve just witnessed a liquidity grab or a stop hunt. These sharp, sudden moves happen when the market sweeps through areas packed with stop orders, collects liquidity, and then snaps back. It’s not random – it’s part of how market makers balance the order book and fill large positions in zones of imbalance.
In simple terms, a liquidity grab is when price spikes to trigger stop-losses or pending orders, creating fuel for the next reversal. In Forex and Gold, these moves are especially common during high volatility sessions – like London or New York opens – when deep liquidity pockets form around obvious highs and lows.
For traders, learning to recognize these traps is essential. Understanding liquidity grab trading means reading the market’s intentions – spotting where institutions collect orders before driving prices in the real direction. Once you see the pattern, you stop reacting emotionally and start executing with precision instead of panic.
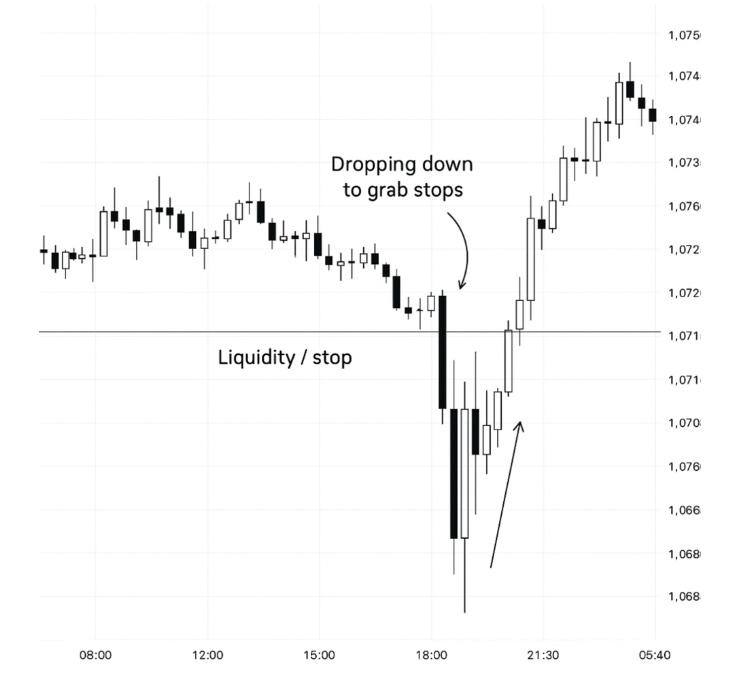
A classic EUR/USD chart on TradingView shows it clearly: price fakes a breakout, sweeps the highs, and reverses in seconds. That’s not chaos – it’s strategy, and this guide will show you how to read and trade it.
What Is a Liquidity Grab and Stop Hunt?
A liquidity grab – also known as a stop hunt – is one of the oldest and most misunderstood price-action phenomena in trading. In essence, it’s when large players (often market makers or institutions) intentionally push the market into areas loaded with stop-loss orders or pending positions. The goal is to trigger those stops, collect liquidity, and then reverse price once enough orders are filled.
In stop hunt forex setups, you’ll typically see this as a sudden, aggressive candle that pierces through a well-known high or low – often the exact level where retail traders place their stops.
The move looks like a genuine breakout, but instead of continuing, price snaps back sharply. Those long wicks on your chart? They’re the footprints of this process – a fast sweep through clustered orders followed by an immediate rejection.
From a market-mechanics perspective, these events are not random manipulation – they’re part of how liquidity is sourced. The order book is never balanced: one side of the market (buyers or sellers) always holds more unfilled orders.
When price reaches a liquidity pocket, the imbalance corrects – large institutions use that surge of orders to execute massive positions efficiently. Without this process, markets would freeze every time a large player wanted in or out.
Visually, you can think of it like this: price moves between zones of accumulation (where institutions build positions) and distribution (where they unload). Retail traders often see these zones as “support” or “resistance,” but to a professional desk, they’re hunting grounds. As price sweeps one side of the range – say, above recent highs – it triggers stops, fills institutional shorts, and reverses. That’s a textbook order flow grab.
The chart pattern usually has three elements:
- A buildup of orders near a key level (a tight consolidation).
- A sharp spike through that level (the stop loss hunt).
- A swift reversal and close back inside the previous range.
Those long wicks mark the battle between retail panic and institutional execution. Retail traders think they’ve been manipulated – and in a sense, they have – but the truth is this behavior is built into the market’s DNA. Stop hunts are how liquidity is recycled and redistributed.
Understanding this dynamic helps you see the market differently. Instead of viewing each spike as chaos or deceit, you start recognizing patterns of intentional movement. These “traps” aren’t tricks – they’re signals that big money has just entered the game, setting the stage for the next directional move.
How to Identify Liquidity Grabs on Charts
Recognizing an order flow grab in real time is one of the most valuable skills for a price-action trader. These moments reveal where institutional money enters and retail traders get trapped – a perfect snapshot of market maker activity. Unlike random spikes or noise, liquidity grabs follow a certain logic: the market reaches for unfilled orders, sweeps through visible stop losses, and then quickly reverses once those orders are triggered.
On charts, they stand out through sharp candles, long wicks, and sudden bursts of volatility. These features signal that a liquidity event just occurred – the market “grabbed” orders sitting beyond a key level, filled institutional demand or supply, and rejected the area instantly. Spotting these tells in time allows traders to prepare for a potential reversal rather than getting caught in the trap.
Visual and Price-Action Clues
The most reliable way to spot order flow grabs is to read the candlestick structure and the context around key highs and lows. A typical pattern includes a buildup, a violent sweep, and a fast rejection. Below are the main signs to look for – each reveals something about how order books and imbalances behave during a liquidity event:
- Long candle wicks. The clearest visual signal. When price pierces a recent high or low and leaves a long tail, it means stops were triggered and liquidity collected. A long upper wick shows that buy-side liquidity was grabbed; a long lower wick means sell stops were hit.
- Sharp reversals. After the sweep, price often snaps back to the previous consolidation or accumulation area. This sudden rejection proves that large orders were executed and the market reversed once liquidity was filled.
- Sudden volatility spikes. Liquidity hunts often appear as short bursts of aggressive movement. You’ll see fast expansion in range and candle size, followed by a slowdown or opposite reaction – a sign of large-scale execution.
- Order block re-tests. Once price reverses, it frequently retests the candle or zone that initiated the move. This re-test offers a low-risk entry for traders targeting the new direction.
- Imbalance correction. Liquidity grabs often fill visible inefficiencies or “gaps” between strong moves. Once this imbalance is corrected, price stabilizes and starts trending cleanly again.
After spotting two or more of these signs together – especially during high-volume sessions – you can reasonably assume that an order flow event has occurred. These patterns are the market’s fingerprint of manipulation and institutional order flow.
Using Indicators to Confirm Liquidity Events
While pure price action is powerful, combining it with data-driven tools can make identification more precise. On TradingView, several built-in scripts can highlight these zones automatically. One of the most popular tools is the liquidity grab indicator TradingView, which marks levels where price temporarily breaks structure and quickly returns.
Other helpful indicators include:
- volume Profile – reveals where large trade clusters appeared during the sweep, confirming that big players entered;
- order Blocks – highlight institutional zones that triggered reversals;
- session Volatility tools – help confirm whether the move happened during a major session (London, New York) when true liquidity is available.
These tools don’t predict the grab; they help validate that what you’re seeing isn’t random movement but intentional liquidity collection driven by imbalanced order flow.
Key Chart Clues and Their Meaning
Before diving into the table, remember that no single clue guarantees a liquidity grab. Context matters: these signs are most reliable around visible highs, lows, or consolidation edges – places where stop orders tend to cluster.
| Chart Feature | Interpretation |
| Long wick below support | Stop sweep of long positions; sell-side liquidity absorbed |
| Long wick above resistance | Stop hunt of short positions; buy-side liquidity collected |
| Sharp rejection candle | Institutional orders filled; beginning of a reversal |
| Volatility spike with fast retrace | Liquidity hunt completed; price returning to balance |
| Order block re-test | Opportunity for refined entry with minimal risk |
| Break above level then return inside range | Confirms trap and prepares for continuation opposite to the sweep |
After analyzing this table, you’ll notice that liquidity grabs tend to leave multiple confirmations – not just one. Long wicks, impulsive reversals, and strong closes back inside the previous range together form the classic signature of an institutional sweep.
Putting It All Together
When you look at charts through this lens, every sharp spike becomes a story of order flow and execution, not randomness. The market seeks imbalance, fills it, and restores equilibrium – and these short bursts of volatility show where it happened.
A trader who understands this doesn’t panic at fake breakouts; they wait for the reversal and plan their entries accordingly. By combining candle analysis with tools like Volume Profile and Order Blocks, you can separate genuine breakouts from manipulation traps, refine timing, and dramatically improve trade accuracy.
Once your eye gets used to spotting liquidity grabs, charts stop being confusing. They turn into maps of where market makers played their hand – and where your next setup might begin.
Failed Breakout vs Liquidity Grab
At first glance, a failed breakout pattern and a liquidity grab look almost identical – both involve a price move beyond a key level followed by a quick reversal. Yet the intent behind each is very different, and understanding that distinction is crucial if you want to learn how to avoid false breakouts and improve your timing around entries and exits.
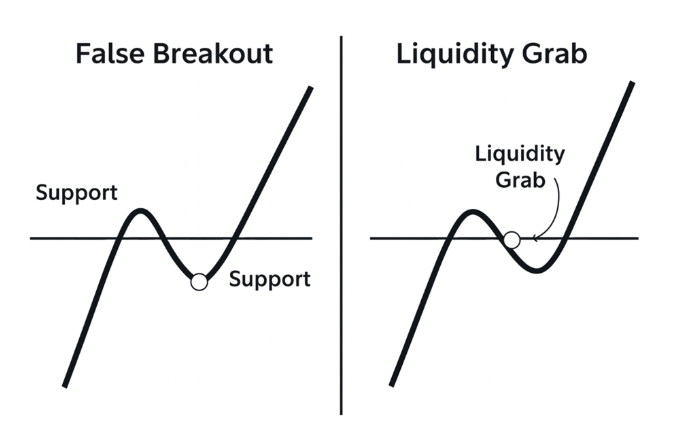
In both cases, traders see a candle breaking above resistance or below support. The difference lies in who is driving the move and why it happens. A failed breakout is simply a technical failure – a move that lacked conviction. A liquidity grab, on the other hand, is a deliberate market event: a temporary breach designed to collect liquidity before a larger breakout or reversal takes place.
What is a Failed Breakout?
A false breakout occurs when price pierces a level but fails to hold above or below it. The move looks promising – momentum expands, retail traders pile in – but the breakout fizzles as orders dry up. Price then slides back into the consolidation zone, trapping those who entered late.
This pattern is often caused by a lack of volume or follow-through. It’s not manipulation, just imbalance: there aren’t enough buyers or sellers to sustain the move. You’ll notice weak candle bodies, limited volatility, and a gradual fade instead of an explosive rejection.
For example, if EUR/USD breaks resistance at 1.0900 and immediately stalls, drifting back into its prior range, that’s a failed breakout. The signal was technical, not institutional. Traders can avoid being caught in these setups by waiting for confirmation – a candle close beyond the level or a retest before entering.
What is a Liquidity Grab?
A liquidity grab is much more intentional. It occurs when market makers or large participants push price through a well-watched level to trigger clustered stop losses and pending orders. Once those stops are activated, the market gains the liquidity needed to fill large institutional positions – after which price sharply reverses.
Unlike a failed breakout, a liquidity grab usually happens with aggressive volatility and clear signs of absorption – long wicks, a sudden reversal, and volume spikes that signal mass order execution. The move often takes seconds, not minutes, and the return into the prior range is violent, not gradual.
A textbook example would be gold (XAUUSD) spiking $5–10 above a daily high, sweeping buy stops, and then crashing back under the level within the same candle. That’s not a weak breakout – that’s a liquidity collection event engineered for large-scale entries in the opposite direction.
How to Tell the Difference
Before diving into the comparison, remember: context is everything. Both patterns happen around key highs and lows, but the structure around the move reveals the truth. Failed breakouts emerge from fatigue – markets losing energy. Liquidity grabs emerge from intent – market makers forcing a reset of the order book to fuel the next trend.
| Feature | Failed Breakout | Liquidity Grab |
| Intent | Unsuccessful attempt to break structure | Deliberate sweep to trigger stops |
| Price Behavior | Gradual return inside range | Sharp rejection and fast reversal |
| Volatility | Moderate or fading | Sudden, explosive spike |
| Volume | Low or steady | Surge during the sweep |
| Candle Wicks | Short, indecisive | Long tails showing aggressive absorption |
| Market Context | Happens after exhaustion | Happens near accumulation/distribution zones |
| Trading Implication | Avoid entries until confirmed breakout | Wait for return inside range, then trade reversal |
Both scenarios can trap scalpers and breakout traders who chase every move. The best defense is patience. Wait for confirmation of control – either the breakout holds, or it fails and re-enters the prior range. For liquidity grabs, the high-probability trade is the reversal entry once the manipulation is complete.
A practical tip on how to avoid false breakouts: don’t trade the first candle that pierces a key level. Instead, wait for a retest or a full candle close beyond the structure. In contrast, when spotting a liquidity grab, look for V-shaped reversals, strong rejection wicks, and a return to the heart of the consolidation area – that’s where the real trade often begins.
Visual Reference
Imagine two charts side by side. On the left, a failed breakout: price nudges above resistance and drifts back slowly, forming small-bodied candles. On the right, a liquidity grab: a sudden spike sweeps the highs, leaving a tall wick, and price slams back into range within seconds.
That visual contrast tells the full story. One is indecision; the other is design. Once you learn to spot the difference, entries become cleaner, exits more precise, and your confidence in reading breakouts skyrockets – because you’re no longer chasing traps, you’re anticipating them.
Market Psychology and the Role of Market Makers
In every market – Forex, Gold, or indices – price moves are not random. They are built on crowd behavior. Psychology drives the flow, and market makers use that flow to find liquidity and create traps for impatient traders. Most traders lose not because of poor analysis, but because they misunderstand how emotions shape market structure.
The average trader reacts, not plans. When price starts breaking out, fear of missing out kicks in. They rush to buy at the top or sell at the bottom, convinced they’ll miss the move. Their stop-losses sit just beyond the nearest swing high or low – exactly where the market will go next. This predictable behavior creates pools of liquidity that professionals use to enter large orders.
Market makers don’t move the market to “hunt” individuals – they seek liquidity to execute size. When there’s an imbalance between buyers and sellers, they push price toward zones where accumulation or distribution can occur. These zones – often the edges of consolidation – are full of trapped retail traders. A quick sweep through those levels triggers the stops, providing the liquidity needed to fill institutional positions. Once filled, price reverses, leaving retail traders on the wrong side again.
Scalpers and beginners are the easiest targets. They trade with high leverage, chase every breakout, and use tight stops. When a small wick forms, they’re out – convinced the market faked them out. In reality, that “fake-out” was the professional’s entry. Their exit is someone else’s beginning.
This constant cycle of emotion – FOMO, panic, revenge trading – feeds the system. Distribution happens when retail traders pile into late longs; accumulation happens when they panic-sell into lows. Every liquidity grab you see is the result of that collective psychology repeating itself over and over.
Smart traders learn to read these emotional imprints. They wait for the trap to trigger – for the liquidity sweep and the quick reversal. Only after the price returns inside the structure do they plan their entries. Instead of fearing the spike, they welcome it: it shows where the big players just positioned themselves.
Practical Trading Strategies
Understanding liquidity grabs is only half the game – the real skill lies in using them to your advantage. These setups don’t just expose where the crowd got trapped; they also highlight where smart money just entered.
With proper timing, entries, and risk control, you can align your execution with institutional flow rather than emotional noise. Below are three practical strategies that combine structure, timing, and psychology to help you trade confidently after a liquidity event.
Trading the Reversal After a Liquidity Grab
The most reliable setup in liquidity grab trading is the post-sweep reversal. After price spikes through a key high or low and quickly returns inside the previous range, the failed expansion signals that the grab is complete and large players have flipped direction.
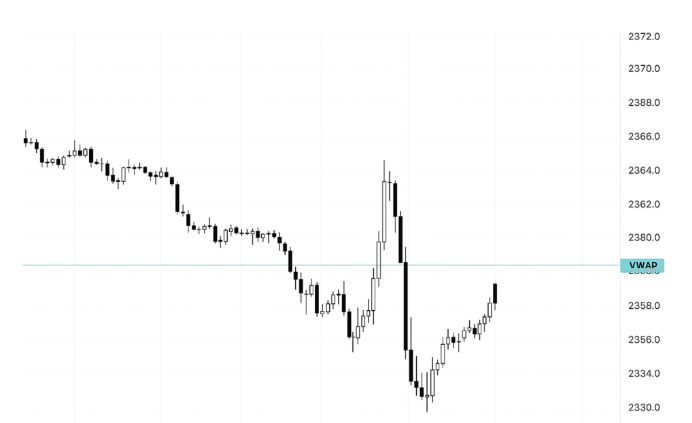
The entry logic is simple: wait for the sweep, let the candle close back inside the structure, and take a position in the opposite direction. For example, on XAUUSD (Gold), a sharp sweep above resistance followed by a close below that level often marks the start of a strong downward move. Add VWAP or another volume-based level for confirmation – if price rejects and returns below VWAP, it’s a clear sign the liquidity was absorbed.
Key execution steps:
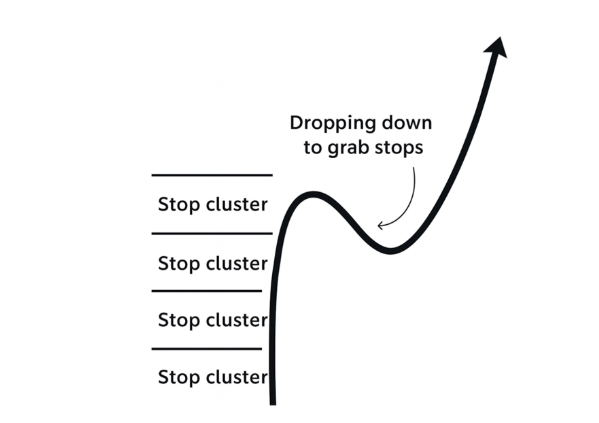
- identify obvious stop clusters – prior highs/lows near consolidation edges;
- wait for a strong impulsive candle that sweeps these levels and leaves a long wick;
- confirm re-entry into the range with a decisive close;
- enter in the opposite direction on the next candle or minor pullback;
- place your stop beyond the wick – outside the liquidity zone – to avoid immediate noise.
This setup offers a clean structure: a defined entry, a clear invalidation level, and excellent risk/reward potential. The goal isn’t to catch every spike but to enter only after the trap is sprung and the reversal is confirmed.
Placing Stops Beyond Liquidity Zones
One of the biggest mistakes retail traders make is placing stops too close to obvious levels. That’s where liquidity gathers – and where market makers will go first. To survive stop hunts, stops must sit beyond the zone where stops are expected to be.
A good rule of thumb is to place your stop-loss beyond the candle wick that defined the liquidity grab or slightly outside the previous accumulation or distribution range. This ensures that even if price makes one final fake move, your position remains intact. Yes, it slightly increases your stop size, but it dramatically improves survival – and with proper risk/reward management (1:2 or better), it’s well worth it.
For instance, if Gold sweeps the lows at 1930.00, prints a long tail, and returns above 1935.00, your long entry might sit at 1936.00 with a stop below 1928.00 – beyond the zone of collected liquidity. It’s safer and statistically stronger than placing a stop right below 1930.00, where everyone else hides theirs.
Trading this way teaches discipline: fewer random losses, cleaner setups, and better execution. The key is to think like a liquidity provider, not a target.
Combining Liquidity Grabs with Support and Resistance
Liquidity events are most powerful when they align with major support or resistance levels. These areas attract both trapped traders and institutional interest, creating perfect conditions for a sweep followed by a directional breakout.
When price tests a key level, ask yourself two questions:
- Is this area obvious enough that most retail traders will react?
- Has price already built up accumulation or consolidation before testing it?
If yes, you have a high-probability setup: the market is likely preparing to grab stops before reversing. Combining this context with support/resistance gives structure to your entries and more precise exits.
For confirmation, use confluence from indicators like VWAP, Order Blocks, or the Volume Profile. Watch for the sweep and rejection candle, then enter with proper leverage and a clear target based on structure.
Below is an example of how such a setup might look in practice:
| Trade Example | Entry (after sweep) | Stop-Loss (beyond zone) | Take-Profit (target) | Risk/Reward |
| Gold (XAUUSD) liquidity grab at resistance | 1954.00 short | 1959.00 | 1942.00 | 1:2.4 |
| EUR/USD sweep below support | 1.0830 long | 1.0805 | 1.0880 | 1:2 |
| GBP/USD fake breakout above range | 1.2820 short | 1.2855 | 1.2740 | 1:2.2 |
In each case, the logic is identical: wait for the trap, let the stop run finish, and enter on confirmation of structure. Your execution becomes systematic – reactive to liquidity, not emotion.
Final Thoughts
Trading around liquidity isn’t about predicting every move; it’s about understanding why the move happens. Liquidity grabs marks where big players enter, not where they exit. By combining these setups with strong technical anchors – VWAP, support/resistance, or order-block logic – you shift from chasing volatility to trading controlled reactions.
Keep your focus on clarity: identify the trap, wait for reversal confirmation, control your leverage, and execute with intent. Liquidity will always be hunted – your job is to make sure it’s no longer yours.
Risks and Limitations
Like any market concept, liquidity grab trading isn’t a guaranteed path to profits. These patterns reveal valuable information about order flow and market psychology, but they don’t work in every situation. Price can fake a liquidity sweep, reverse halfway, or continue trending without ever giving a clear signal. Understanding these risks – and testing your strategy properly – is what separates a professional trader from a pattern chaser.
The first limitation is false signals. Not every long wick or stop run represents a true liquidity grab. Sometimes, what looks like a manipulation is just a normal reaction to volatility or unexpected news. In such cases, traders who assume every spike is a trap may enter too early and get caught on the wrong side. Always confirm the setup: look for structure breaks, clear rejection candles, and a close back inside the previous range before taking any entries.
Another risk lies in execution. During liquidity events, spreads widen, slippage increases, and orders may not fill at intended prices. This is especially common in Forex and Gold, where liquidity pools can shift instantly during major sessions or macro releases. Even a perfect read of the pattern can fail if you can’t manage execution and position size. Keeping your leverage moderate and stops placed safely beyond the sweep zone helps mitigate these issues.
High volatility is both a blessing and a curse. Liquidity grabs thrive on aggressive moves, but excessive volatility can destroy timing and invalidate setups. A market moving too fast doesn’t give you the chance to confirm reversals or manage risk effectively. Avoid trading directly into news events and watch for periods when spreads or candle ranges expand unnaturally – that’s where consistency breaks down.
Finally, no liquidity-based system is complete without backtesting. You must validate how these setups behave over hundreds of examples across different pairs and timeframes. Study historical accumulation, distribution, and sweeps. Note how often the reversal actually followed through, how deep the wicks went, and what confirmation worked best. Only after data proves reliability should you risk real capital.
FAQ
What is liquidity grab trading?
It’s a strategy that focuses on spotting where large players collect liquidity by triggering clustered stop orders. Traders use these “sweeps” as signals for potential reversal or continuation moves once the market returns inside structure.
How to avoid false breakouts in Forex?
Wait for confirmation – a candle close beyond the level or a clean retest before entering. Avoid reacting to the first spike; patience filters out most traps and fake breakouts.
What is a failed breakout pattern?
It’s when price temporarily breaks a key level but fails to stay above or below it, quickly returning to the previous consolidation. Unlike a liquidity grab, it’s not an intentional move by market makers, just a lack of follow-through.
Can stop hunts be predicted?
Not precisely, but you can anticipate likely zones by watching areas where retail entries and stop losses cluster. Highs, lows, and round numbers are frequent targets for these stop loss hunts.
Are liquidity grabs manipulation?
They might look like manipulation, but in reality, they’re a normal part of market mechanics. Liquidity has to be sourced somewhere – these moves simply show where institutions find it.
Conclusion
Liquidity grabs and stop hunts aren’t market tricks – they’re part of normal price mechanics. Once you understand how and why they happen, you can use them to trade alongside institutional flow instead of getting trapped by it.